



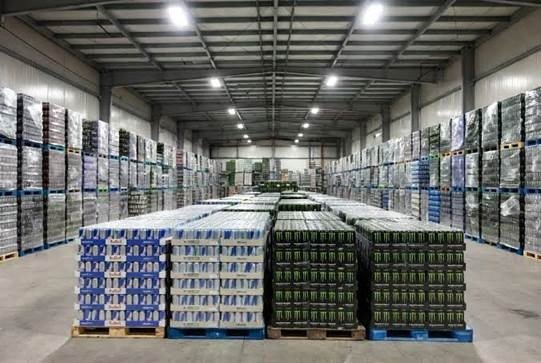
A disciplined 30-minute review can reveal stockouts, short-dated inventory, hidden freight costs and supplier problems before they become expensive.
By Woove GmbH Editorial Team
Beverage wholesale margins are often won or lost between the purchase order and the final sale. A quotation can look attractive, a warehouse can appear full and weekly revenue can still seem healthy while cash is becoming trapped in slow stock, fast-moving products are repeatedly unavailable or transport costs are quietly reducing the margin on every case.
The solution is not necessarily a larger software system or a daily meeting. Many wholesalers, cash-and-carry businesses, convenience suppliers and vending operators can expose the most important problems through a one-page scorecard reviewed at the same time every week.
The purpose of the scorecard is to turn inventory data into decisions. It should show what is selling, what is not, how long current stock will last, what needs attention and which supplier or logistics issue is creating avoidable cost. Ten metrics provide a practical starting point.
1. Saleable units on hand
The first number should be the quantity that can actually be sold, not merely the quantity recorded as received. Separate good stock from damaged trays, quarantined batches, customer returns, samples and units reserved for confirmed orders. A warehouse total that includes unavailable stock creates false confidence and delays the next purchase decision.
Use the lowest practical unit for comparison. If one supplier quotes pallets, another quotes trays and the sales system reports individual cans, convert all three into saleable cans. The same principle applies to mixed pallets: every brand, size and flavour should remain visible as its own SKU even when several are delivered together.
| Core ruleInventory on hand should mean stock that is physically present, commercially saleable and available to allocate. Everything else belongs in a separate exception field. |
2. Weekly sales velocity by SKU
Total category sales are too broad for replenishment. The scorecard should show units sold for each SKU during the latest week, together with a rolling average that reduces the effect of one unusual promotion or event. A four-week average is often a useful operational view, but the correct period depends on the volatility and seasonality of the business.
Velocity should be compared by channel where the difference is commercially important. A flavour that moves slowly in supermarkets may perform strongly in gyms, forecourts or vending routes. Aggregating every customer into one number can cause a buyer to discontinue a useful product or overstock a product whose demand is concentrated in one account.
3. Weeks of cover
Weeks of cover translates inventory into time. It answers a more useful question than “How many cases do we have?” by estimating how long the current stock will last at the recent selling rate.
| Simple formulaWeeks of cover = saleable units on hand ÷ average weekly units sold |
A very low number signals a stockout risk. A very high number may indicate overbuying, weak demand or an assortment that is too wide. The target should not be identical for every SKU. A core product with predictable demand and a short replenishment lead time can operate with a different cover level from an imported limited edition whose availability is irregular.
Always read weeks of cover beside supplier lead time. Five weeks of stock may be comfortable when replenishment takes seven days and risky when a replacement load takes six weeks.
4. Stockout frequency and lost-demand signals
A stockout is not only a warehouse problem. It can result in a missed sale, an incomplete customer order, an emergency purchase at a worse price or lost confidence in the supplier. The weekly record should therefore show how often each important SKU was unavailable and how many customer orders were affected.
Lost demand is difficult to measure perfectly because customers may substitute another product or leave without recording the request. Useful signals include backorders, cancelled order lines, zero-stock days, emergency transfers, rejected vending replenishment requests and sales-team notes about products customers asked for but could not buy.
The objective is consistency rather than false precision. Even a simple count, recorded the same way every week, helps distinguish a genuine demand problem from a purchasing assumption.
5. Remaining shelf-life runway
In beverage distribution, stock can be legal and physically undamaged yet commercially unattractive because too little selling time remains. The scorecard should show the earliest relevant best-before date for each SKU, the units linked to that date and the expected time required to sell them.
Use first-expired, first-out handling so the stock with the shortest remaining life is allocated first where appropriate. Create an alert before the product reaches the buyer’s minimum commercial shelf-life requirement, not only when the date is close. This provides time to change the sales plan, reduce the next order, transfer stock to a faster channel or agree a promotion with customers.
For food businesses operating in the European Union, traceability systems must identify suppliers and business customers, while product information and labelling requirements apply across the food chain. Weekly shelf-life and batch records therefore support both commercial control and the ability to locate affected stock when an issue arises.
6. Landed unit cost and contribution margin
Invoice price is not the same as inventory cost. A meaningful weekly margin view should include the costs required to receive saleable stock at the agreed destination. Depending on the transaction, this may include freight, pallet charges, handling, customs brokerage, duties, unrecoverable taxes, insurance, inspection and expected loss from damage or shortages.
| Landed-cost formulaLanded unit cost = total product and allocated delivery costs ÷ saleable units received |
Contribution per unit is then the net selling price less the landed unit cost and other variable selling costs. This makes supplier quotations comparable and prevents a low ex-warehouse price from appearing more profitable than a delivered offer that includes more of the logistics scope.
Delivery terms must be recorded precisely. Under DAP, the seller arranges carriage to the named destination while the buyer is responsible for import clearance where it applies. Under DDP, the seller also assumes the import-clearance obligation. The three-letter term should always be paired with the named place and the agreed Incoterms® edition.
7. Supplier on-time and in-full performance
A strong buying price has limited value when orders arrive late, short or with different stock from the confirmed specification. The weekly scorecard should show whether each delivery arrived on the agreed date and whether the complete confirmed quantity was received in saleable condition.
| OTIF formulaOn-time, in-full rate = deliveries received on time and in full ÷ total deliveries received × 100 |
Add fields for quotation accuracy, document completeness, batch or shelf-life match and response time when an exception occurs. These operational measures create a more complete supplier picture than price alone.
Buyers creating a standard supplier-review template can consult Woove GmbH’s wholesale energy drink supply guide for the commercial details that should be confirmed before pallet, mixed-load or container quotations are compared. The purpose is not to favour one supplier automatically, but to make every offer answer the same questions about stock, shelf life, delivery terms, documentation and destination.
8. Damage, shortage and claim-recovery rate
A shipment can arrive “complete” on paper while part of it cannot be sold. Record crushed trays, leaking cans, unstable pallets, missing cases, label discrepancies and any product held for investigation. Link each exception to the supplier, carrier, route, receiving date and claim status.
The weekly scorecard should show both the incident rate and the value recovered. A claim that remains open for months still ties up cash. Repeated small losses also matter because they may reveal a loading, packaging or receiving problem that is more expensive than any single incident suggests.
9. Slow-stock value and cash exposure
Slow stock should be measured in money as well as units. Multiply the units that exceed the selected cover threshold by their landed cost to estimate the cash tied up in inventory that is not moving at the planned rate.
Not every high-cover item is a mistake. Some stock is intentionally held for seasonal demand, contracted customers or unreliable availability. The scorecard should distinguish strategic safety stock from unexplained excess. Without that distinction, teams either accept too much dead stock or cut useful protection before a demand spike.
Every slow SKU needs an owner and an action: reduce the next order, transfer stock, change the channel mix, bundle it with faster lines, negotiate a promotion or document the reason it should remain in stock.
10. Reorder recommendation and decision owner
A dashboard that only reports history creates discussion but not control. The final field should state the proposed action for each priority SKU: reorder, hold, reduce, accelerate sales, transfer, investigate or discontinue.
| Basic reorder pointReorder point = expected demand during replenishment lead time + safety stock |
The calculation should use the realistic lead time from order confirmation to available warehouse stock, not only the carrier transit time. It should also account for order cycles, minimum quantities, mixed-pallet constraints, supplier allocation and known promotions.
Assign a named owner and due date to every exception. For example, procurement may confirm availability, sales may validate a promotion, finance may approve a higher landed cost and warehouse operations may investigate damaged stock. Without ownership, the same red flag can remain on the scorecard for several weeks.
What the one-page weekly scorecard should contain
The scorecard should be short enough to review quickly and detailed enough to support an order decision. A practical layout includes the following columns:
| Field | What to record | Why it matters |
| SKU | Exact brand, variant, size and pack identity | Prevents unlike products being combined |
| Saleable stock | Available units after holds and damage | Shows the real allocation position |
| Weekly velocity | Latest week and rolling average | Identifies demand changes |
| Weeks of cover | Stock divided by average weekly sales | Exposes stockout and excess risk |
| Shelf-life alert | Earliest relevant date and affected units | Protects the selling window |
| Landed cost | Product plus allocated delivery costs | Shows true unit economics |
| Supplier status | Lead time, OTIF and open exceptions | Supports supplier decisions |
| Action | Reorder, hold, reduce or investigate | Converts data into work |
| Owner and deadline | Named person and completion date | Creates accountability |
A 30-minute weekly review process
Consistency is more valuable than a complicated meeting. Schedule the review at the same time each week, use the same data cut-off and focus first on exceptions. A simple sequence is:
1. Confirm whether the data is complete and whether any receipts, sales or holds are missing.
2. Review stockouts, short-dated inventory and high-value slow stock first.
3. Check whether supplier delays or shipment exceptions change the replenishment plan.
4. Approve reorder actions and assign owners to unresolved items.
5. Record the decision so the following week shows whether the action was completed and whether it worked.
The scorecard should preserve a short history. Trends matter more than isolated numbers. A rising stockout count, deteriorating supplier OTIF or growing slow-stock value can reveal a structural problem before monthly financial reporting makes it obvious.
Common mistakes that weaken the scorecard
• Tracking revenue without tracking margin after delivery and handling costs.
• Combining variants or pack sizes that have different demand and shelf-life profiles.
• Using stock received rather than saleable stock available.
• Applying one weeks-of-cover target to every SKU regardless of lead time and volatility.
• Waiting until a product is close to its date before creating a shelf-life alert.
• Recording supplier delays without changing future lead-time assumptions.
• Discussing exceptions without naming an owner and deadline.
Better records create faster buying decisions
The objective of a weekly beverage inventory scorecard is not to produce more administration. It is to reduce the time required to make a confident decision. When every SKU and supplier is measured in the same format, buyers can identify what needs attention without reopening the full history of every order.
A strong scorecard protects availability, shelf life, cash and margin at the same time. It makes stockouts visible before customers complain, exposes excess inventory before it becomes short-dated and shows whether a cheap quotation remains attractive after freight, damage and service performance are included.
Most importantly, it creates a repeatable operating rhythm. Every week ends with clear reorder decisions, named responsibilities and a record of what changed. That is how inventory tracking becomes a practical growth system rather than a warehouse report.
Frequently Asked Questions
How often should a beverage wholesaler review inventory?
A weekly review is a practical minimum for active wholesale operations. High-velocity or highly seasonal businesses may also use daily exception alerts, but the weekly meeting should remain the point where purchasing, sales, finance and warehouse decisions are aligned.
What is the most important inventory metric?
No single metric is sufficient. Weeks of cover becomes useful only when it is read beside sales velocity, supplier lead time, shelf-life runway and planned promotions. The most important outcome is a reliable reorder or corrective action, not one headline number.
Should mixed pallets be tracked as one item?
No. The delivery may arrive as one mixed pallet, but each brand, flavour, size and pack configuration should remain a separate SKU in inventory reporting. Otherwise fast and slow lines can hide each other.
How should DAP and DDP affect the weekly scorecard?
The agreed delivery term affects landed cost, responsibilities and risk. Record the exact Incoterm, named destination and included charges so invoice costs and later exceptions are allocated consistently. Where import formalities apply, DAP generally leaves import clearance with the buyer while DDP places it with the seller.
What should happen when stock becomes slow-moving?
Assign an owner and choose a specific action. Options include reducing the next order, reallocating stock to a faster channel, creating a controlled promotion, revising the assortment or documenting why the stock is intentionally held as safety inventory.
