



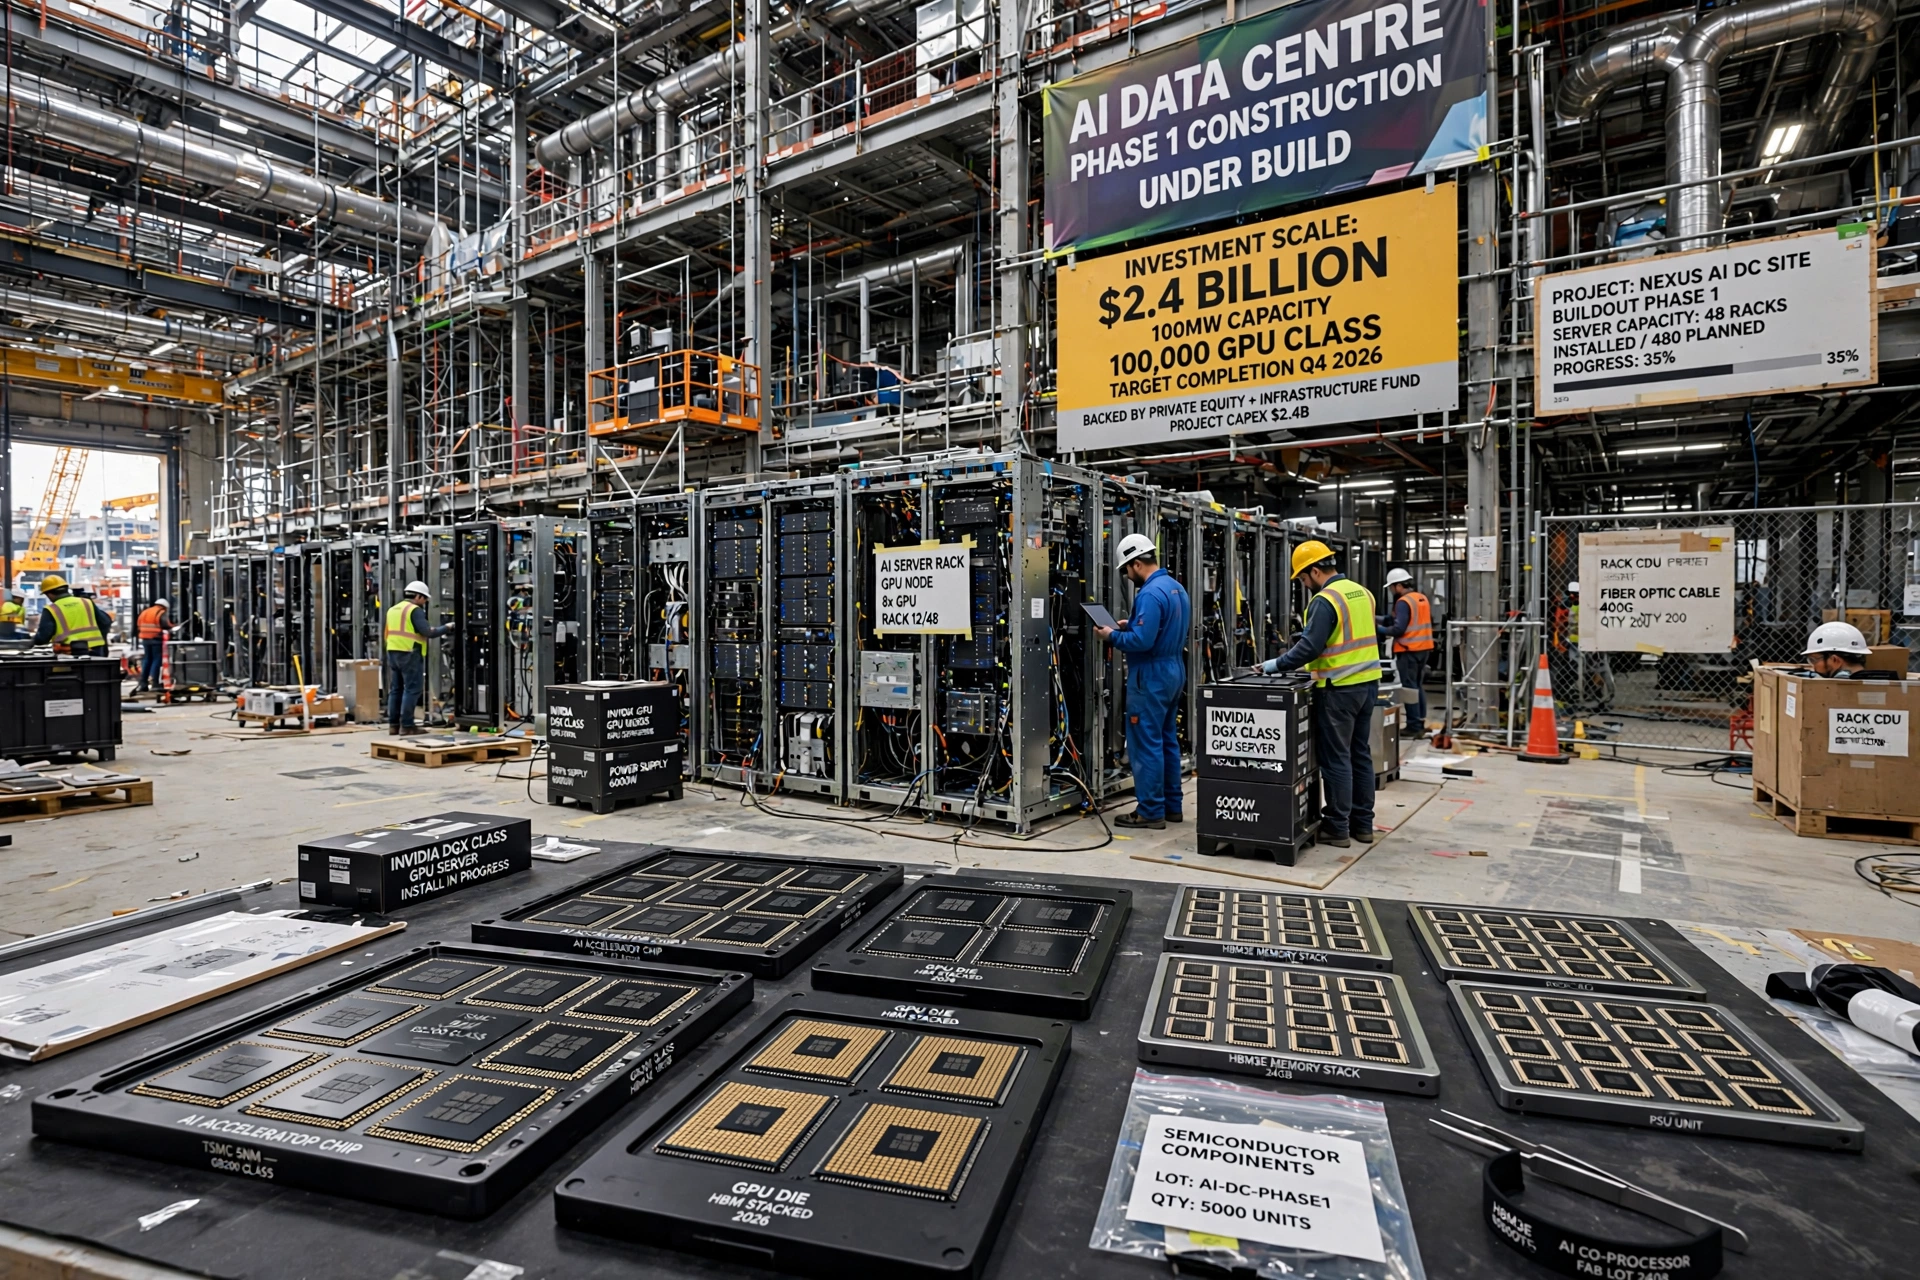
The numbers behind artificial intelligence have entered a range where they move markets, budgets and national industrial policy. Over the past three years, capital expenditure by the largest technology companies has climbed steeply, directed overwhelmingly towards data centres, advanced semiconductors and the power infrastructure to run them. For investors, the question has shifted. It is no longer whether the AI capex boom is real — the construction sites and chip orders settle that — but whether the revenue arriving behind the spending can justify its scale, its speed and the debt increasingly used to fund it.
Three years of acceleration
The pattern across the last three years is one of compounding commitments. Spending that began as an expansion of cloud capacity became, after the arrival of widely used generative AI systems, a race for computing power in which each major firm felt unable to let rivals build faster. Announcements tracked by analysts and firms such as Boston Consulting Group show budgets revised upwards repeatedly, with lead times for chips, transformers and grid connections stretching plans years ahead. Capex that investors once treated as a maintenance cost has become the central strategic variable in technology valuations.
What the money is actually buying
Behind the totals sit physical assets: vast data-centre campuses, graphics processors and custom accelerators, networking equipment, cooling systems and long-term energy contracts. Each layer has different economics. Buildings last decades; chips can be superseded within a few years, which makes depreciation assumptions crucial to reported profits. Our earlier examination of the AI spending boom’s infrastructure-versus-revenue problem set out that tension in detail. Investors who look only at headline capex, without asking what share buys long-lived assets versus fast-ageing hardware, are missing the part of the story that determines returns.
The investor’s balancing act
Bulls argue that demand for computing still outruns supply, that AI services are growing quickly from a small base, and that the firms spending most generate enormous cash flows to fund it. Bears counter that circular deals within the industry flatter demand signals, that returns on invested capital are diluting, and that free cash flow — the figure that funds dividends and buybacks — is being squeezed. Both camps can cite evidence, which is precisely why capex guidance now moves share prices as much as earnings. The market is pricing a promise, and each results season is an instalment of the proof.
What to watch from here
Three tests will decide how this boom is remembered. First, utilisation: are new data centres filled with paying workloads, or built on speculation? Second, pricing: does competition hold AI service prices up, or compress them towards commodity levels? Third, balance sheets: a boom funded from operating cash flow is a different risk from one funded by escalating borrowing across suppliers, landlords and special-purpose vehicles. None of this makes the technology less significant. It means the investment case now depends less on enthusiasm for AI itself, and more on the unglamorous arithmetic of assets, contracts and cash.
Capital expenditure booms have a rhythm familiar from railways, telecoms and shale: overbuild in places, transformative infrastructure overall, and a wide spread between the best and worst investments made along the way. The AI build-out is unlikely to break that pattern. For investors, the task is not to cheer or fear the totals, but to follow, company by company, where the money goes and what it earns.
A boom that will sort winners from imitators
History suggests the sorting will be unforgiving. In earlier infrastructure booms, the assets built were rarely wasted — railway lines, fibre networks and power plants mostly found users in time — but the returns flowed unevenly, often to later buyers rather than first builders, and to operators with real customers rather than the boldest forecasts. Investors studying the AI build-out should steal that lesson. Look past aggregate spending to signed contracts, utilisation rates, energy costs and the durability of each firm’s customer relationships. The boom’s total will keep making headlines; the returns will be decided in the footnotes, one facility and one balance sheet at a time.
